

What impact has the air pollution reduction measures introduced by the City of London Corporation over the past six years had? That’s what we’re aiming to find out! Levels of particulate matter and nitrogen dioxide can be a concern in urban areas. Both air pollutants are associated with fuel combustion; transport and heating.
Back then
In 2014 we led a comprehensive year-long Air Quality Citizen Science monitoring project with residents of the Barbican Estate. ‘Science in the City’ aimed to increase public understanding about air pollution amongst residents, and how concentrations of different pollutants varied with time and spatially across the Barbican Estate and surrounding area. It was the largest, community based, citizen science air quality monitoring project to be carried out in the UK over the course of a year at that time.


The original project focused on monitoring two of the major ambient air pollutants, nitrogen dioxide and particulates and residents were consulted on any actions they would like to see taken over subsequent years to improve local air quality.
Six years on
After implementing several of these initiatives around the Barbican including a Low Emission Neighbourhood, traffic management in Beech Street, experimental traffic programme, and the Mayor of London Ultra Low Emission Zone, we are repeating and broadening this residents’ citizen science project.
The nitrogen dioxide monitoring began in March 2021 with 54 tubes being hosted by residents of the Barbican and Golden Lane Estates and 17 further tubes sited at street locations and within the nearby Middlesex Estate.


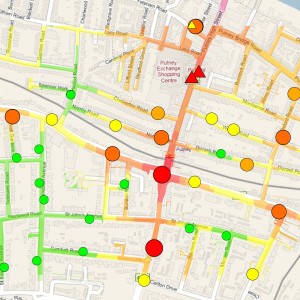
The data are now available for the first four months of the monitoring and the graphs below show how the levels compare to the data that was collected six years previous. It is clear to see that the pollution in 2021 is much lower than before, however, it is also clear to see how much the pandemic has reduced traffic in the City.
As Covid-19 restrictions are easing across the UK it will be interesting to see if the nitrogen dioxide levels remain low in comparison to 2014 or if in fact they return to the previous levels once again. So, watch this space!
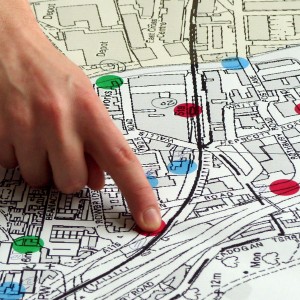
Maps
Maps can show you where you are. But a good map can also show you where you want to go, and how to get there.
With a map, you can communicate, analyse and enact change. We work with communities to achieve social and environmental change in their local area.
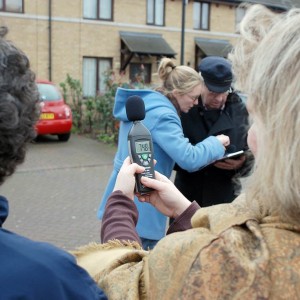
Citizen Science
Environmental problems affect us all. Citizen Science can give you a voice. Let’s collect the data we need to raise awareness and fight for change.
Low tech and affordable methods mean that everyone within a community can get involved and become a citizen scientist.
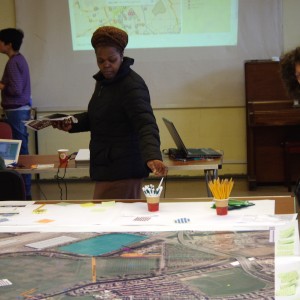
Community Engagement
Does your organisation work with community groups? We can design and implement a unique engagement approach, tailored to your particular requirements.
With over 15 years experience in the community and voluntary sector, we understand how to reach and involve people.
Map Visualisation & Analysis
Space is complicated. Map visualisation & analysis can help you to understand and discover what’s going on.
We have expertise in the use of Geographical Information Systems, and we can apply it to meet your needs.
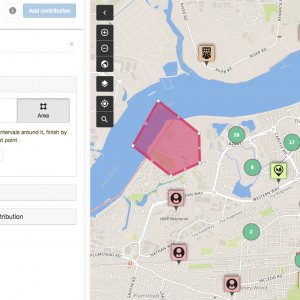
Online Mapping Platforms
It’s good to collaborate. Contribute, share and discuss your ideas about the places that matter with Community Maps, our online participatory mapping platform.
Community Maps provides an effective tool for community and multi-stakeholder consultation across a range of projects and sectors.