It’s 10 am on Wednesday, 2nd of March, and a cold wind is bringing dark clouds. The menace of bad weather does not discourage Tina. She comes out with a ladder, a bag full of diffusion tubes to measure nitrogen dioxide (NO2) in the air, a notebook and a map of the neighbourhood. Some other neighbours join her in the street for a picture.
Smile! Let’s start the work!
They have co-financed the necessary tools and lab analysis through the crowdfunding campaign (http://www.crowdfunder.co.uk/community-air-pollution-monitoring) set-up by Mapping for Change and are now ready to go out and measure air quality in locations of their choice – mainly in front of schools and busy road crossings.
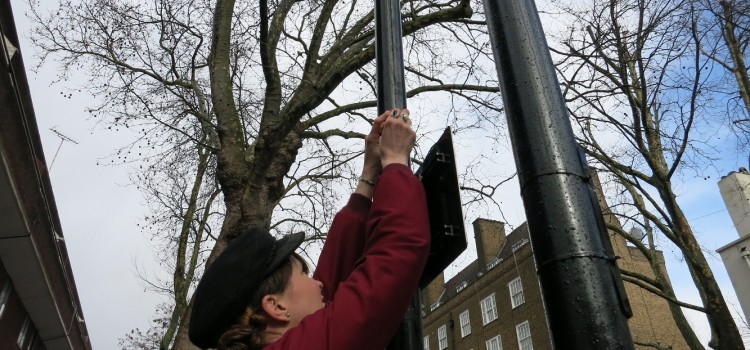
The first location is a roadside lamppost in front of a school. Tina goes up the ladder and fixes a cable tie around the lamppost and then attaches a holder where the diffusion tube will sit for a period 4 weeks. Now, they record the location, site characteristics, exact time, and identification number of the tube. The next step is fixing the tube to the holder, with one end openly exposed and facing downwards, so the air can flow inside.
It starts to rain heavily and some neighbours leave, seeking shelter. Only Tina, a friend, and a visiting researcher from Barcelona, stay to endure the bad weather. While placing the fifth diffusion tube of the morning, rain turns into hail and thunder starts to clap! Everyone runs into the community centre nearby and enjoys a cup of hot tea while chatting about the experience and why they care about air quality. There are still 7 more locations in the map of Somers Town waiting for them. At 11:30 the rain stops and another helping hand joins.
After 4 weeks, Tina will go out again with her neighbours to take the diffusion tubes down and send them to the lab for analysis. The lab will provide the readings of NO2 for that period in each location. They will receive the data, update the details in the Mapping for Change Air Quality app which will automatically publish the data on the Community Air Quality Map for everyone to see.
NO2 is an air pollutant originating mainly from emissions of diesel vehicles in cities and can affect health (http://www.unep.org/tnt-unep/toolkit/pollutants/nitrogen.html). Will they discover that they are exceeding the European Union legal limits or the World Health Organisation recommended limits?