Mapping for Change is working with the Tower Hamlets community to undertake an Air Quality Mapping project, commissioned by The London Borough of Tower Hamlets.
The Breathe Clean project began in April and will run until November, incorporating six months of citizen science to monitor nitrogen dioxide. Tower Hamlets residents have shown a healthy interest in the project, with eager volunteers having been allocated all the available diffusion tubes. Data from May -the first month of monitoring- is viewable on Mapping for Change’s community maps platform. So what has been done so far?
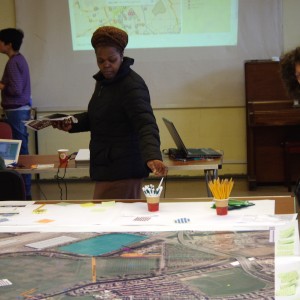
Workshops
Two workshops were delivered in April, which introduced the public to the project and recruited residents to host diffusion tubes. One workshop was held in a housing cooperative in Bethnal Green and the other at the Idea Store Bow. A number of residents were parents who had concerns about the impact of poor air quality on their children’s health.
Diffusion tube monitoring
29 locations are being monitored over the next 6 months:
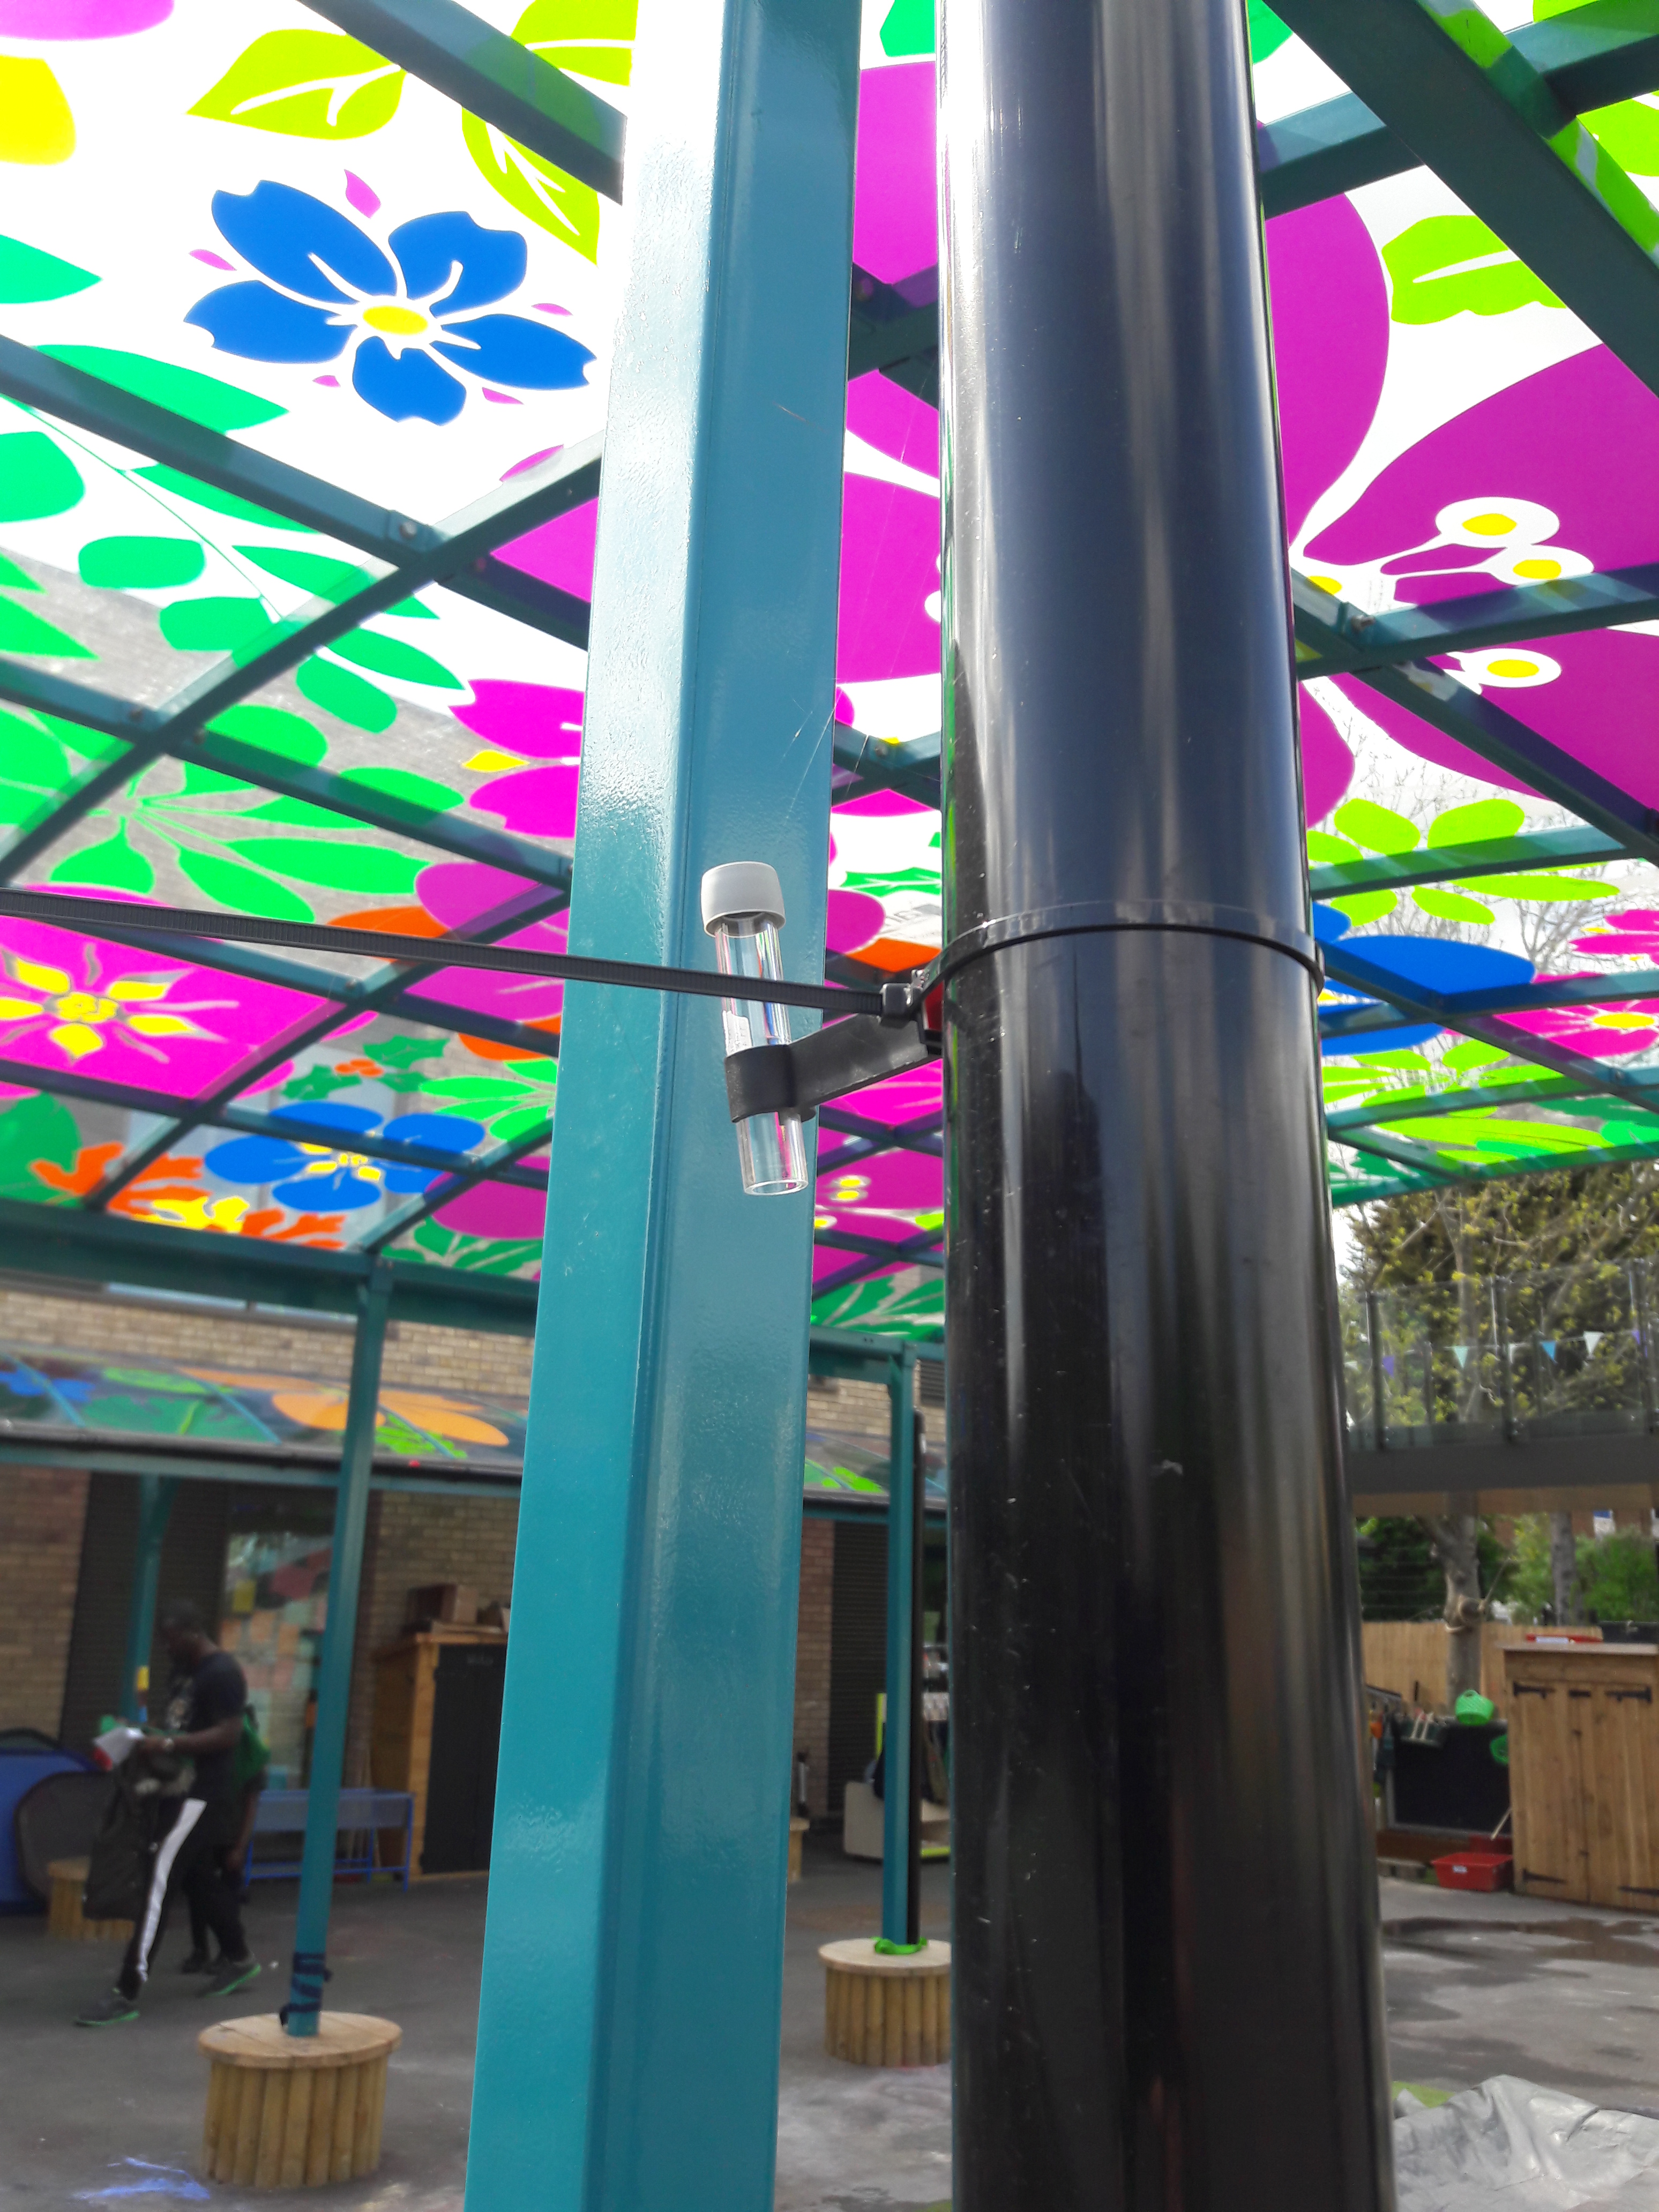 Four locations are within St Leonard’s Priory, Bromley-By-Bow and six locations are at or near local schools – Olga Primary School, Harbinger Primary School, Canon Barnett Primary School, St John’s CE Primary School, Hermitage Primary School and Wellington Primary School.
The first month’s monitoring results are back from the lab. The readings were varied, with around half of the diffusion tubes giving readings within EU legal limits of nitrogen dioxide, and the rest exceeding limits to varying degrees. The results can be viewed on the Community Map here.
Particulate monitoring
- Residents expressed their concerns about local particulate pollution, particularly along the canal and around schools.
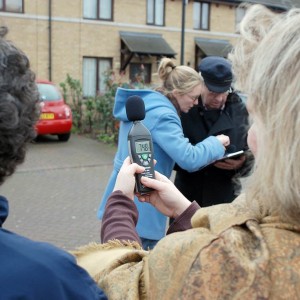
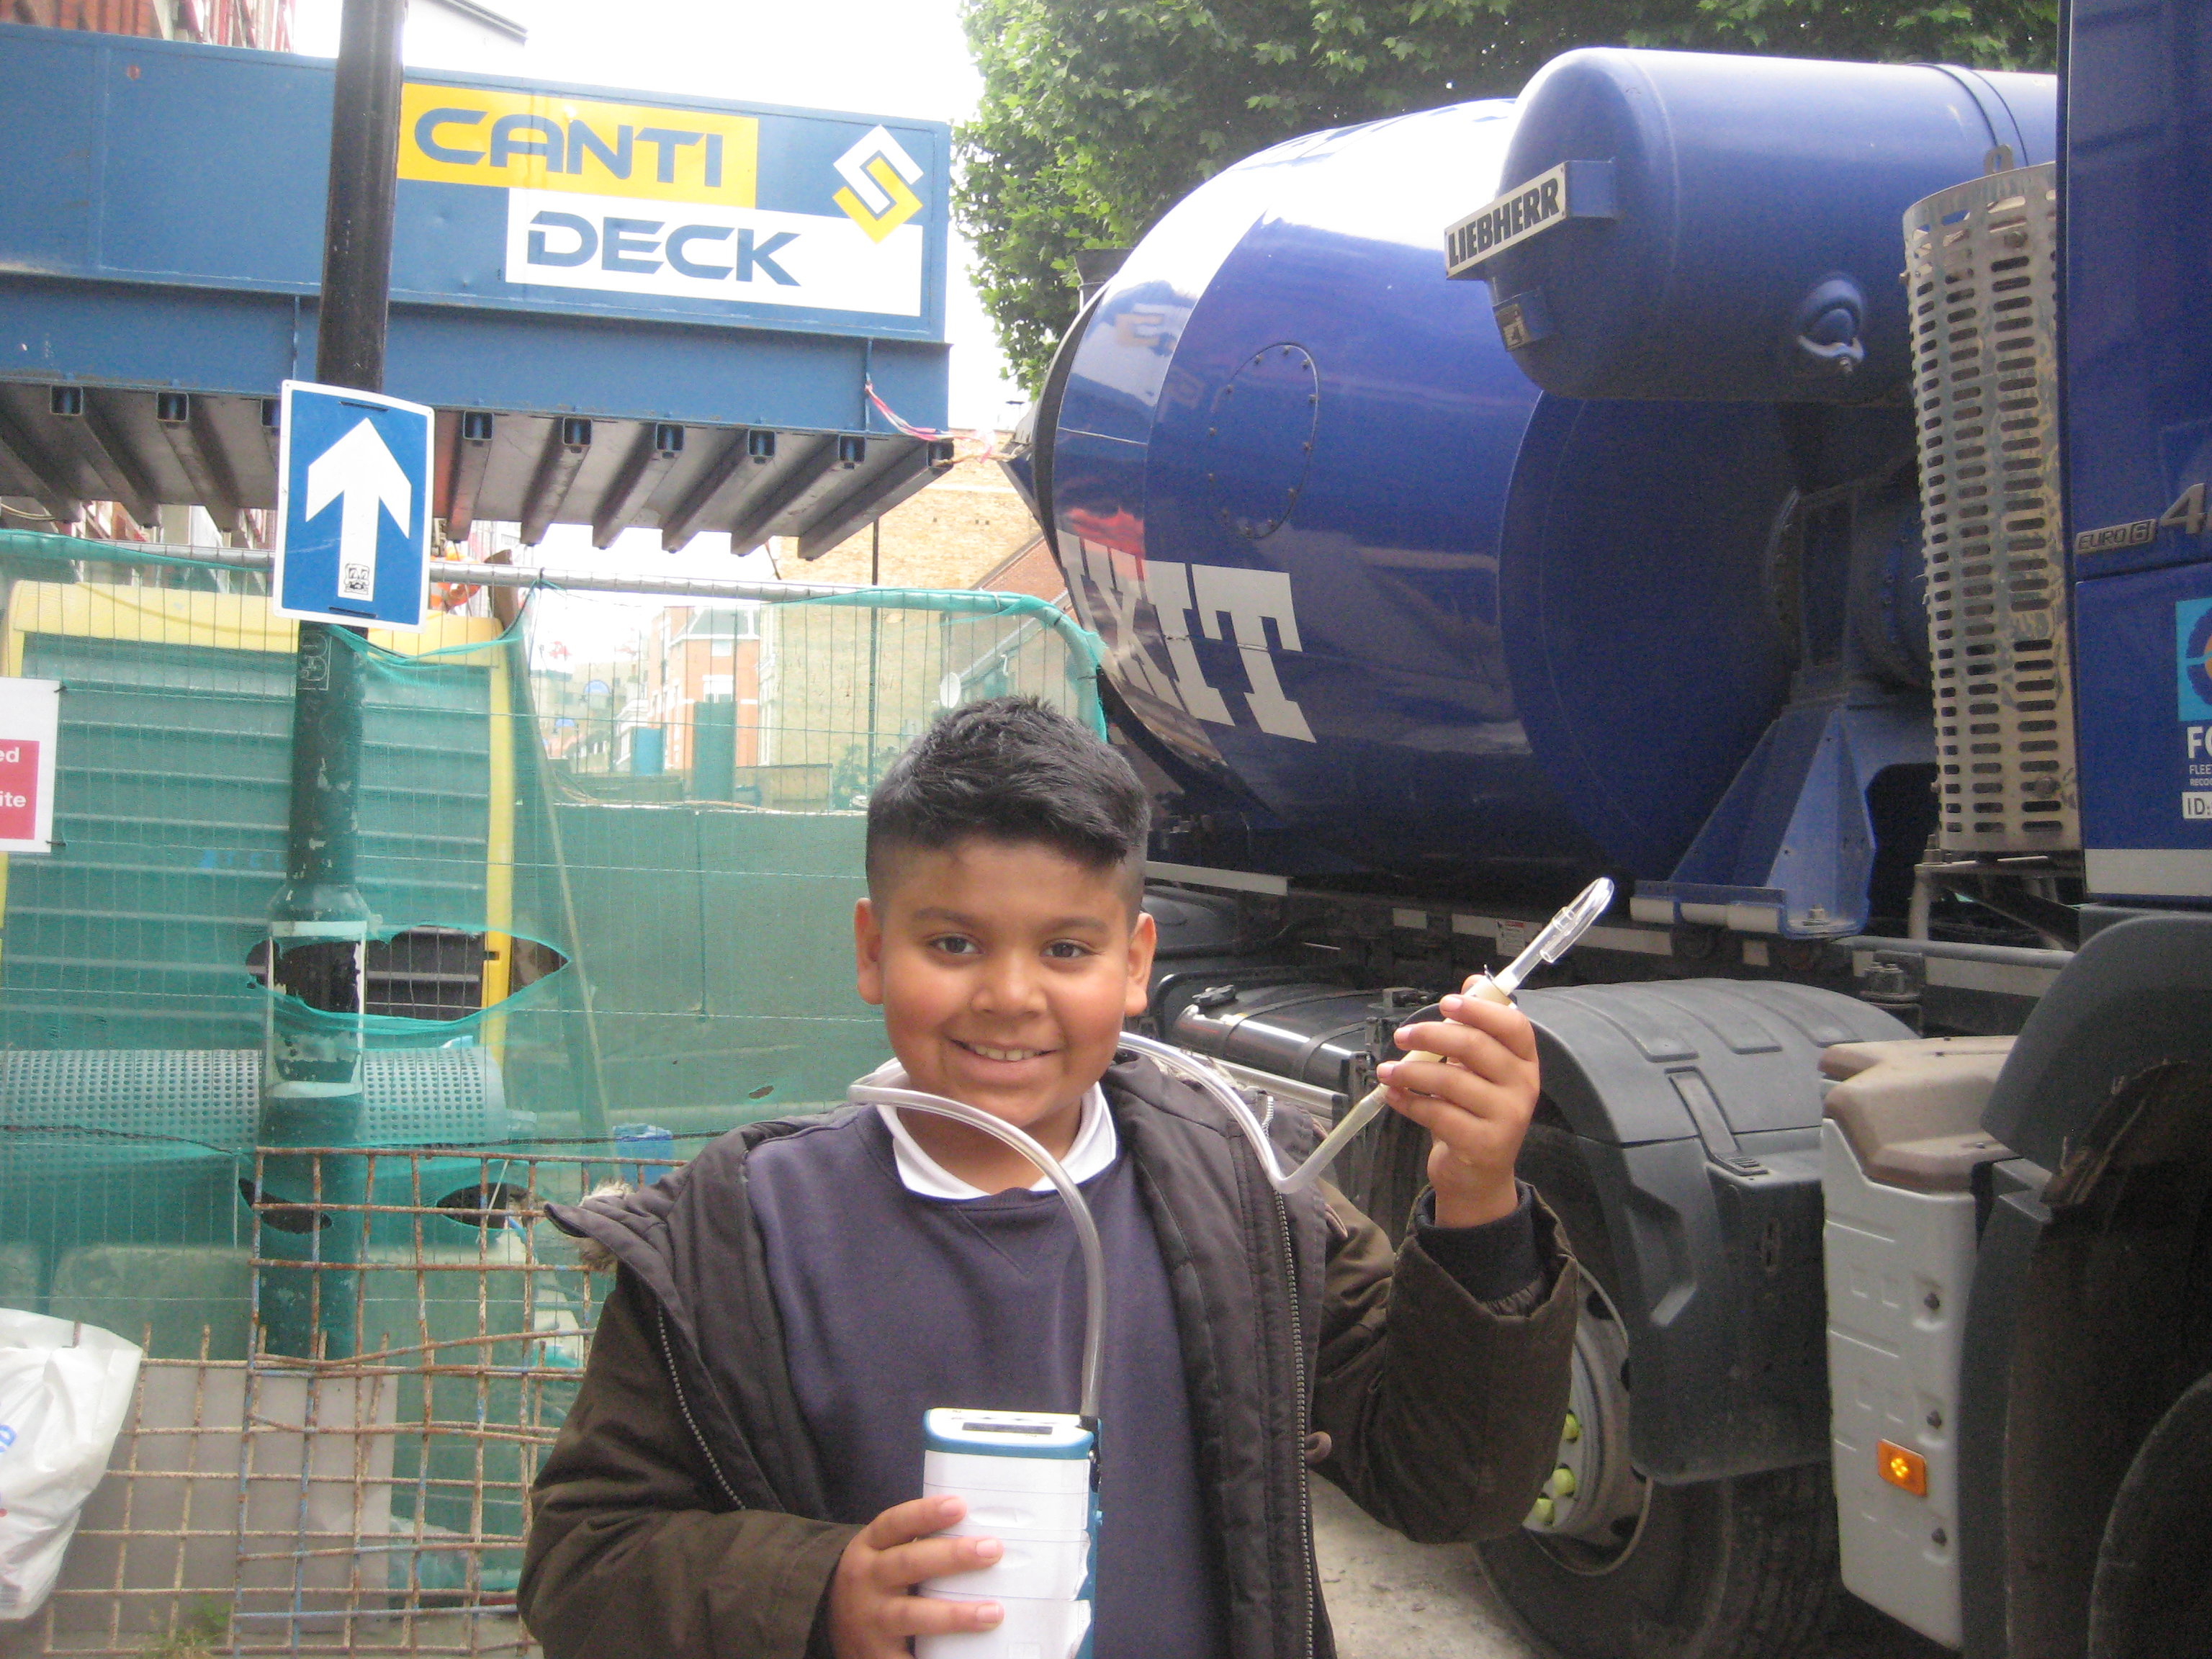
- To date we have trained three residents to use the equipment and all have collected data on their neighbourhood/commute etc. A teacher at Canon Barnett School was one such resident and she and her class monitored the PM2.5 around their school. The pupils enjoyed their ‘pollution walks’, getting a taste for both air quality monitoring and map-making.
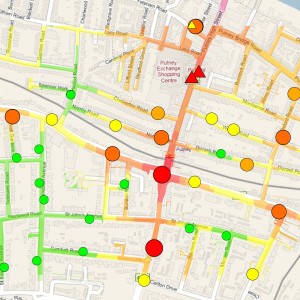
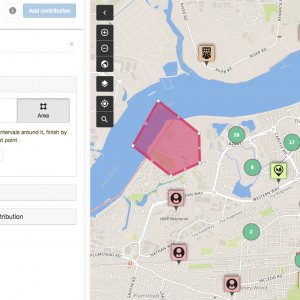
- Click here to see an example map generated from participant data. This map displays the PM2.5 levels recorded by a resident whilst cycling in Tower Hamlets. Air samples are taken every 10 seconds, as represented by the dots. All the samples recorded PM2.5 levels higher than the EU guidelines (25 micrograms/m3). The lower levels (white dots) appear to be recorded more often near green spaces. This could suggest the benefit of green infrastructure, however more monitoring needs to be undertaken to prove this.
Outreach
Canon Barnett School requested a presentation about the project to their pupils, which we did in June. The class then went on to monitor particulates as well as the diffusion tube they are hosting. The pupils are currently writing letters about how to reduce air pollution. Images below are of their ‘pollution walk’.

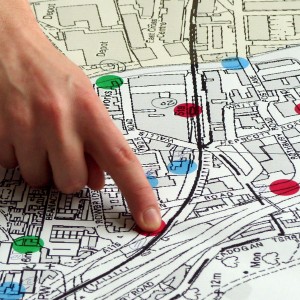
Maps
Maps can show you where you are. But a good map can also show you where you want to go, and how to get there.
With a map, you can communicate, analyse and enact change. We work with communities to achieve social and environmental change in their local area.
Citizen Science
Environmental problems affect us all. Citizen Science can give you a voice. Let’s collect the data we need to raise awareness and fight for change.
Low tech and affordable methods mean that everyone within a community can get involved and become a citizen scientist.
Community Engagement
Does your organisation work with community groups? We can design and implement a unique engagement approach, tailored to your particular requirements.
With over 15 years experience in the community and voluntary sector, we understand how to reach and involve people.
Map Visualisation & Analysis
Space is complicated. Map visualisation & analysis can help you to understand and discover what’s going on.
We have expertise in the use of Geographical Information Systems, and we can apply it to meet your needs.
Online Mapping Platforms
It’s good to collaborate. Contribute, share and discuss your ideas about the places that matter with Community Maps, our online participatory mapping platform.
Community Maps provides an effective tool for community and multi-stakeholder consultation across a range of projects and sectors.